Display aggregated values in tables
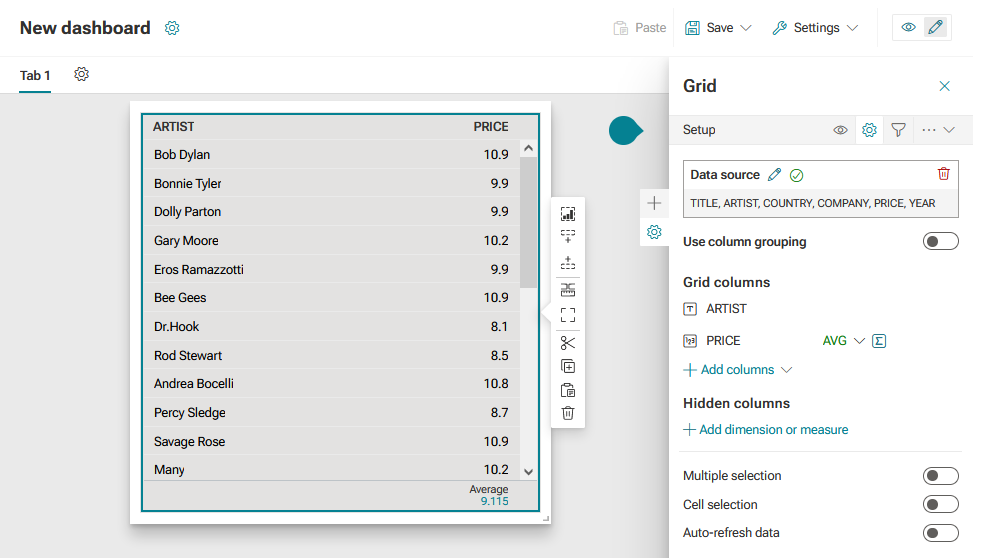
You can display aggregated values, that is average, total, and count values for each measure in a table. The values are displayed in the last row of the corresponding columns.
Add at least one numerical column to the Grid widget.
On the Setup panel of the widget, click Add columns > Standard columns. The Grid columns panel opens.
Select a numerical column.
Click Done. The selected column is added to the Setup panel.
On the Setup panel of the widget, click the
 Total aggregation icon of a numerical measure. The corresponding panel opens to configure the value aggregation.
Enable Show to display the aggregated value in the table.
Select the aggregation type in the Type drop-down menu.
Select the color for the values displayed in the table.
Click Done.
The aggregated column value is displayed in the table.
The table in the example contains the text column ARTIST the numerical column PRICE and shows the average value of the column in the bottom row.